
I. Aurora Professional Zones at a Glance

A. Overview & Owner
Aurora Professional Zones is a TradingView indicator from Aurora Trading, available on whop. The page headline promises to “Maximize Profits with Elite Supply & Demand Indicators.” The focus is institutional supply and demand across markets, delivered directly on your charts. Everything is presented as a streamlined way to turn preparation into action.
B. What It Delivers
Real-time updates highlight institutional supply and demand zones across all markets and securities. The goal is to bring the most important reaction areas into a single view. With zones visualized on the chart, plans are easier to structure before the session. You’re equipped to decide where engagement makes the most sense.
C. Who It’s For
Traders who anchor decisions around supply and demand will feel at home immediately. If you prefer objective levels over subjective guesswork, the workflow fits. Multi-asset traders can keep a consistent framework across symbols. The indicator is designed for clarity whether you’re scanning or focusing narrowly.
II. Setup, Tutorial & Documentation
A. TradingView Access
Access includes the analysis indicator directly on TradingView. You add it to your chart layout and save a template for daily use. The idea is to keep levels visible where you make decisions. No extra platforms or switching are required.
B. Video Tutorial Included
A comprehensive video tutorial shows how to set up and use the indicator. The walkthrough helps you configure options quickly. You’ll see what to expect on first load and how to tailor visibility. This keeps onboarding fast so you can focus on planning.
C. Documentation & Examples
Documentation includes trade entry and exit examples to illustrate application. You can compare your plan to the examples before placing a trade. Notes reinforce how zones translate into risk and management. Refer back to the docs whenever you adjust your checklist.
III. From Zones to a Daily Routine
A. Mapping Institutional Areas
Start each session by marking zones that matter most. Align your primary scenario to the nearest area of interest. Define invalidation so the plan is objective before price moves. With the map set, your focus shifts from hunting to executing.
B. Planning Entries & Exits
Use the examples to frame entry style, initial stop, and first targets. Keep position sizing tied to the distance between entry and invalidation. Let the nearest opposing zone inform profit-taking. This keeps actions rule-based rather than reactive.
C. FAQs to Clarify Use
The page addresses how the indicator works and customization options. Review these notes when you first install to avoid guesswork. Small configuration choices can improve readability for your timeframe. Clear settings make it easier to repeat the routine.
IV. Reviews, Access & Related Products

A. Review Snapshot
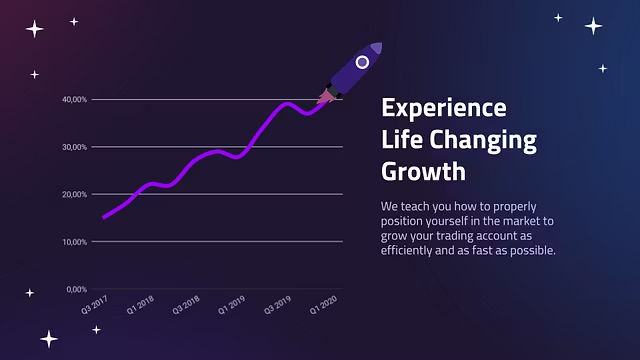
The storefront shows an average rating of 4.96 from 111 total reviews at the time of writing. Feedback emphasizes time saved and confidence in marked zones. Treat sentiment as perspective on user experience, not a guarantee. Your outcomes still depend on discipline and risk rules.
B. Plan & Trial
Access includes the indicator, tutorial, and documentation with a 3-day trial for onboarding. Access and management run through the same account you use for checkout. Keep notification settings aligned to your schedule for updates. Confirm details on the page before you start.
C. Related Options from the Brand
Additional products from Aurora Trading appear alongside the indicator. You can explore the broader education and community options if you want more support. Keep choices tied to your current workflow so focus stays tight. Expand only when the routine is stable.