
I. Introduction
In the fast-paced world of financial markets, particularly for those venturing into the realm of day trading options on stocks like SPY, QQQ, and SPX, understanding the foundational elements of technical analysis is paramount. Among these, support and resistance levels stand out as critical tools. These levels offer deep insights into market behavior, acting as invisible barriers that can significantly influence the trajectory of stock prices. For day traders, who capitalize on short-term price movements, recognizing and interpreting these levels can be the difference between a successful trade and a missed opportunity.
Support and resistance levels are not just mere lines on a chart; they represent key psychological thresholds where the forces of supply and demand converge. In essence, support levels are where a downtrend can pause due to a concentration of demand, while resistance levels are where an uptrend may halt temporarily due to a surge in supply. These levels are pivotal in decision-making, helping traders to identify potential entry and exit points, anticipate market movements, and manage risks more effectively.
For beginners and seasoned traders alike, mastering the art of identifying and leveraging support and resistance levels is a vital skill. It enables a trader to navigate through the volatility and uncertainties inherent in day trading options. By applying this knowledge, traders can enhance their ability to analyze market trends, make informed predictions, and execute trades with greater confidence and precision. In the following sections, we will delve deeper into these crucial concepts, shedding light on their definitions, significance, and strategic applications in the dynamic world of trading.
II. Understanding Support and Resistance Levels

A. Definition and Significance
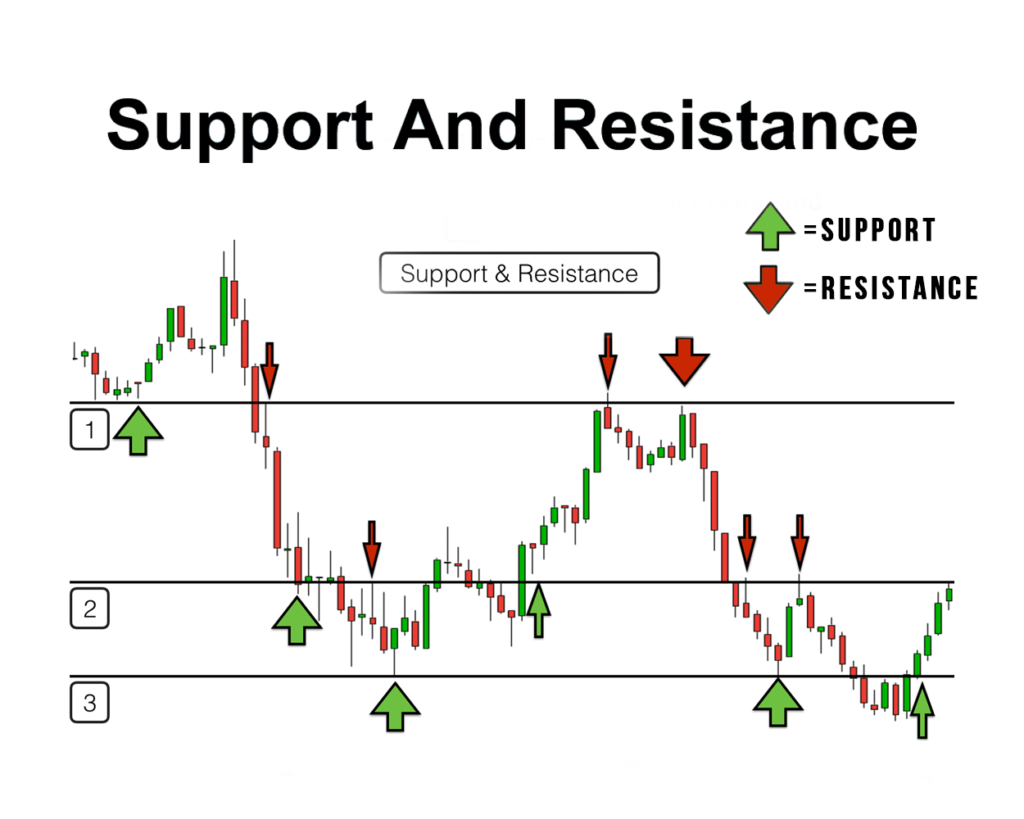
In the realm of technical analysis, support and resistance levels are akin to the backbone of market dynamics. A support level is where the price of an asset, like a stock or option, tends to stop falling and begins to bounce back upwards. It’s a point where buyers enter the market in sufficient numbers to halt the decline, signaling a potential reversal or pause in the downtrend. Conversely, a resistance level is where the price tends to stop rising, meeting a surge in selling pressure that overcomes buying momentum. This level indicates a ceiling of sorts, where sellers outweigh buyers, potentially leading to a price reversal or consolidation.
Understanding these levels is crucial for traders, especially in the context of day trading options. They serve as indicators of where significant buying or selling interest exists, based on historical price movements and trader psychology. By identifying these levels, traders can make more informed decisions about entry and exit points, set better stop-loss and take-profit orders, and gauge the strength of market trends. For options traders, these levels help in selecting strike prices and expiry dates, aligning their strategies with expected price movements.
B. Role Reversal Phenomenon
A fascinating aspect of support and resistance levels is their ability to switch roles – a concept known as role reversal. Once a support level is breached, it can transform into a resistance level, and vice versa. This phenomenon occurs because the breached level leaves a psychological imprint on the market participants’ minds, affecting their future decision-making.
For a day trader dealing with options, understanding role reversal is crucial. It provides insights into potential future price barriers and helps in adjusting strategies accordingly. When a known support level is broken, traders anticipate it becoming a resistance in the future, preparing for a sell-off when prices approach this new resistance. Similarly, when a resistance level is overcome, it becomes a new support level, indicating a potential buying opportunity in anticipation of a price bounce.
In summary, the role reversal of support and resistance levels is an integral part of trading strategy. It not only reflects the ongoing battle between buyers and sellers but also underscores the dynamic and ever-changing nature of market psychology. By mastering this concept, traders, especially those engaged in the fast-paced world of day trading options, can significantly enhance their ability to predict price movements and make strategic trading decisions.
III. Identifying Support and Resistance Levels
A. Historical Price Analysis
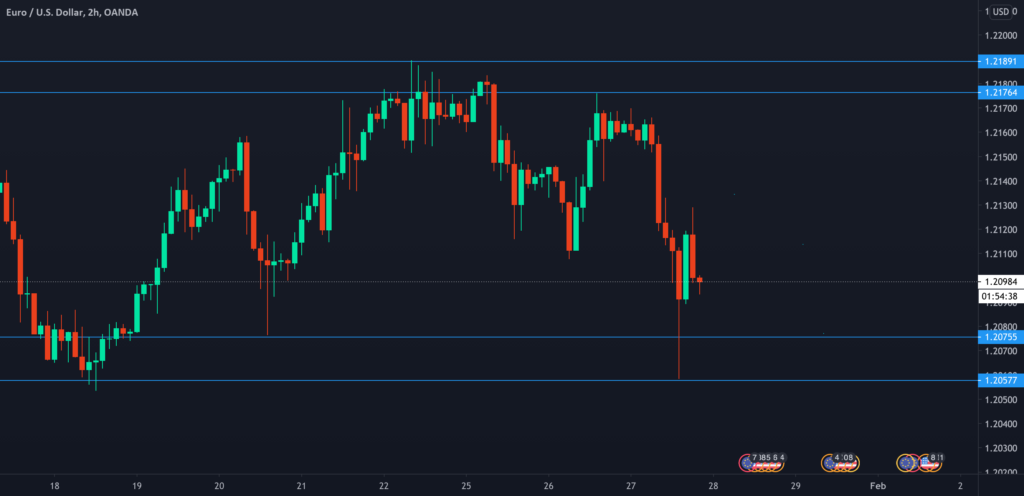
One of the most effective ways to identify support and resistance levels is through historical price analysis. This involves examining past price movements of a stock or option to pinpoint where significant reversals or pauses in trends have occurred. Key techniques include:
Swing Highs/Lows: These are the peaks and troughs seen in price charts. A swing high is a point where the price peaked before reversing downwards, while a swing low is where it bottomed out before moving upwards. By connecting these points, traders can outline potential support (at swing lows) and resistance (at swing highs) levels.
Pivot Points: Pivot points are calculated using the high, low, and close of the previous trading period. They provide a set of potential support and resistance levels for the current trading session. Traders, especially in day trading, use these points to predict short-term price movements.
Moving Averages: These are indicators that smooth out price data to identify trends. Moving averages, like the 50-day or 200-day, often act as dynamic support or resistance levels. For example, a 200-day moving average might act as a major support level in an uptrend, indicating a potential area where prices might bounce back.
Historical price analysis allows traders to develop a roadmap of where the price might react. This is particularly crucial in options trading, where understanding potential price movement boundaries can significantly impact strategy effectiveness, especially in short-term trades like day trading.
B. Volume Analysis
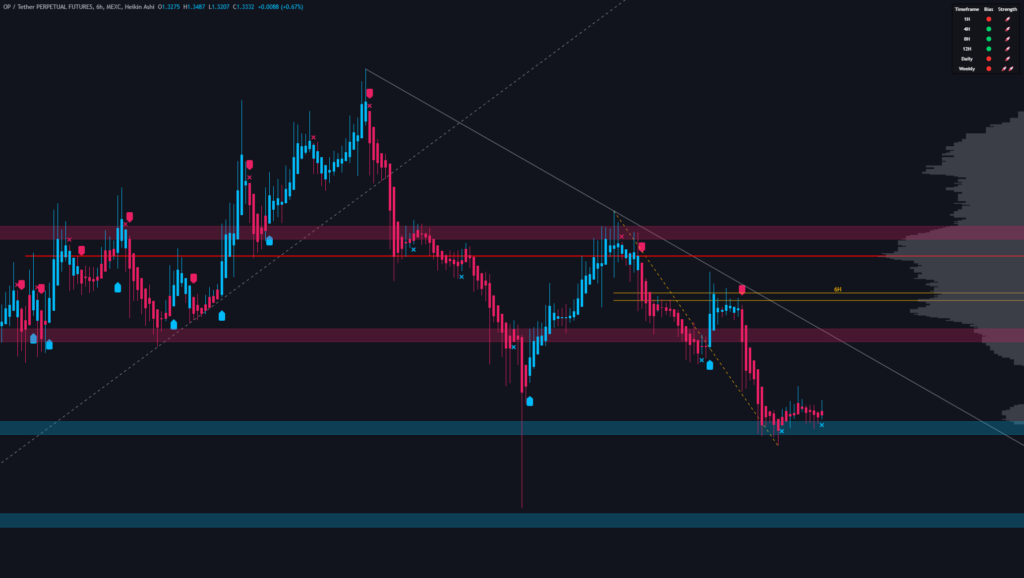
Volume plays a crucial role in validating support and resistance levels. It provides insights into the strength behind price movements. Key aspects include:
Volume Clusters: These are areas where a significant amount of trading activity has occurred, often visible on volume histograms. High volume at a particular price level strengthens the validity of that level as support or resistance.
Volume-Based Indicators: Indicators like On-Balance Volume (OBV) and Volume-Weighted Average Price (VWAP) blend price and volume data. They help identify where large traders are likely to enter or exit positions, influencing the price.
For day traders in options, where timing and price direction are crucial, combining volume analysis with price action offers a more robust framework. Volume analysis can confirm or question the strength of support and resistance levels, enabling more precise entries and exits. High volume at a support or resistance level may suggest a strong likelihood of price reversal, while low volume might indicate a weaker level that could be easily broken. This understanding is essential in developing trading strategies for options trading, where leverage can amplify gains as well as losses.
V. Advanced Techniques for Support and Resistance Analysis
A. Multiple Time Frame Analysis
For a more holistic approach, analyzing support and resistance levels across multiple time frames is invaluable. This technique offers a comprehensive view of the market, revealing trends and levels that might be overlooked when focusing on a single time frame.
- Comprehensive Perspective: For instance, a support level in a daily chart might also align with a significant level in a weekly chart, reinforcing its strength. This congruence across time frames often signals a more robust and reliable trading opportunity.
- Strategic Application in Day Trading: Options traders, particularly in day trading, can benefit from this approach. For example, identifying a support level on a longer-term chart (like weekly) and then using a shorter-term chart (like hourly) to pinpoint entry points can lead to more precise and profitable trades.
B. Fibonacci Tools
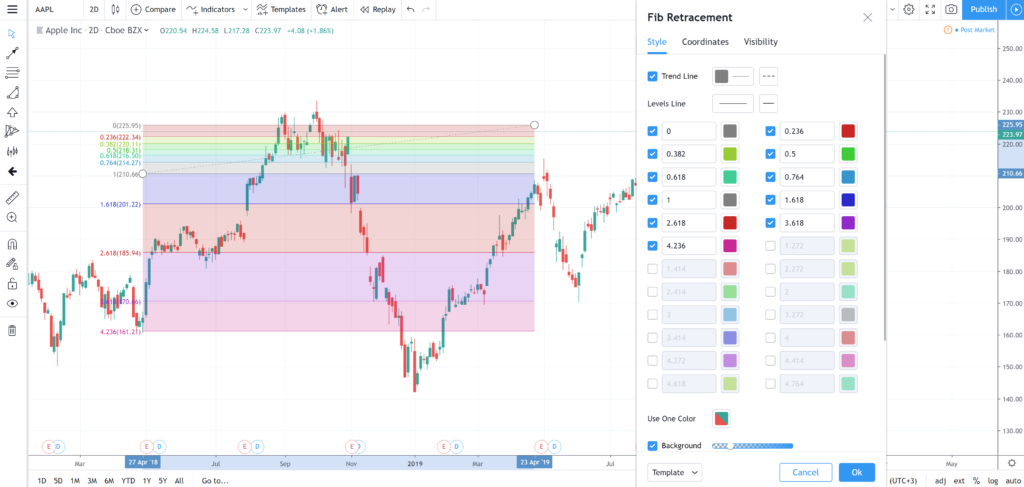
Fibonacci retracements and extensions are powerful tools that complement support and resistance analysis, providing potential levels for reversals or continuations of trends.
- Retracements for Pullbacks: Fibonacci retracements help identify potential support levels during a pullback in an uptrend or resistance levels in a downtrend. The common retracement levels – 38.2%, 50%, and 61.8% – often align with key support or resistance zones.
- Extensions for Price Targets: Fibonacci extensions are used to project where the price might go following a retracement. These levels are invaluable for setting profit targets, especially in options trading, where timing is crucial due to the expiration of contracts.
C. Integrating with Other Technical Indicators
Combining support and resistance analysis with other technical indicators can significantly enhance the efficacy of trading strategies.
- Indicator Confluence: For example, a support level coinciding with an oversold reading on the Relative Strength Index (RSI) can provide a stronger signal for a potential upward reversal.
- Enhanced Decision Making in Options Trading: In options trading, integrating indicators like moving averages, RSI, or Bollinger Bands with support and resistance levels can guide in selecting strike prices and expiration dates. It adds an extra layer of validation to the support and resistance analysis, increasing the probability of successful trades.
By incorporating these advanced techniques, traders can develop a more nuanced understanding of market behavior. This is especially beneficial in the fast-paced environment of day trading options, where such insights can lead to more strategic and informed trading decisions.
VI. Common Mistakes to Avoid
A. Overreliance on Support and Resistance
While support and resistance levels are vital tools in technical analysis, overreliance on them can lead to missed opportunities or misinterpretation of market signals. It’s essential to remember that these levels are just one part of a broader analytical framework.
- Balanced Approach: A balanced trading strategy should incorporate other aspects of technical analysis like trend lines, chart patterns, and indicators. This approach reduces the risk associated with relying solely on support and resistance levels, which may not always hold.
- Contextual Analysis in Options Trading: For options traders, especially in day trading, it’s crucial to consider the option’s time decay, volatility, and other Greeks alongside support and resistance. This ensures a more comprehensive analysis and better decision-making.
B. Ignoring Market Conditions
Market conditions are dynamic, and support and resistance levels must be interpreted within the context of these changing conditions.
- Adaptability: Traders must stay attuned to news, economic events, and overall market sentiment. A support level that held during a bullish market may not hold in a bearish scenario.
- Strategic Adjustments for Options Traders: Options traders should adjust their strategies according to market conditions. For instance, in high volatility conditions, support and resistance levels may be less reliable, necessitating different strategies like straddles or strangles.
C. Neglecting Confirmation Signals
Relying on support and resistance levels without seeking confirmation can lead to premature or risky trades.
- Seeking Confirmation: Look for confirmation signals like candlestick patterns, volume spikes, or indicator confirmations before taking a position. This reduces the likelihood of false breakouts or breakdowns.
- Confirmatory Indicators in Options Trading: In options trading, confirmation signals are crucial for timing entries and exits. For example, entering a call option at a support level with a bullish candlestick pattern and a rising RSI can increase the probability of a successful trade.
Avoiding these common mistakes can significantly improve the efficacy of trading strategies, especially in the nuanced arena of day trading options. A well-rounded approach, adaptability to market changes, and reliance on confirmation signals are key to navigating the complexities of the markets.