This content is for informational and entertainment purposes only, not financial advice. Trading involves risk and is not suitable for all investors. This article may contain affiliate links, which means Pro Trading Insights may earn a commission if you sign up through a link. For full details, see our Affiliate Disclosure and Full Disclaimer.
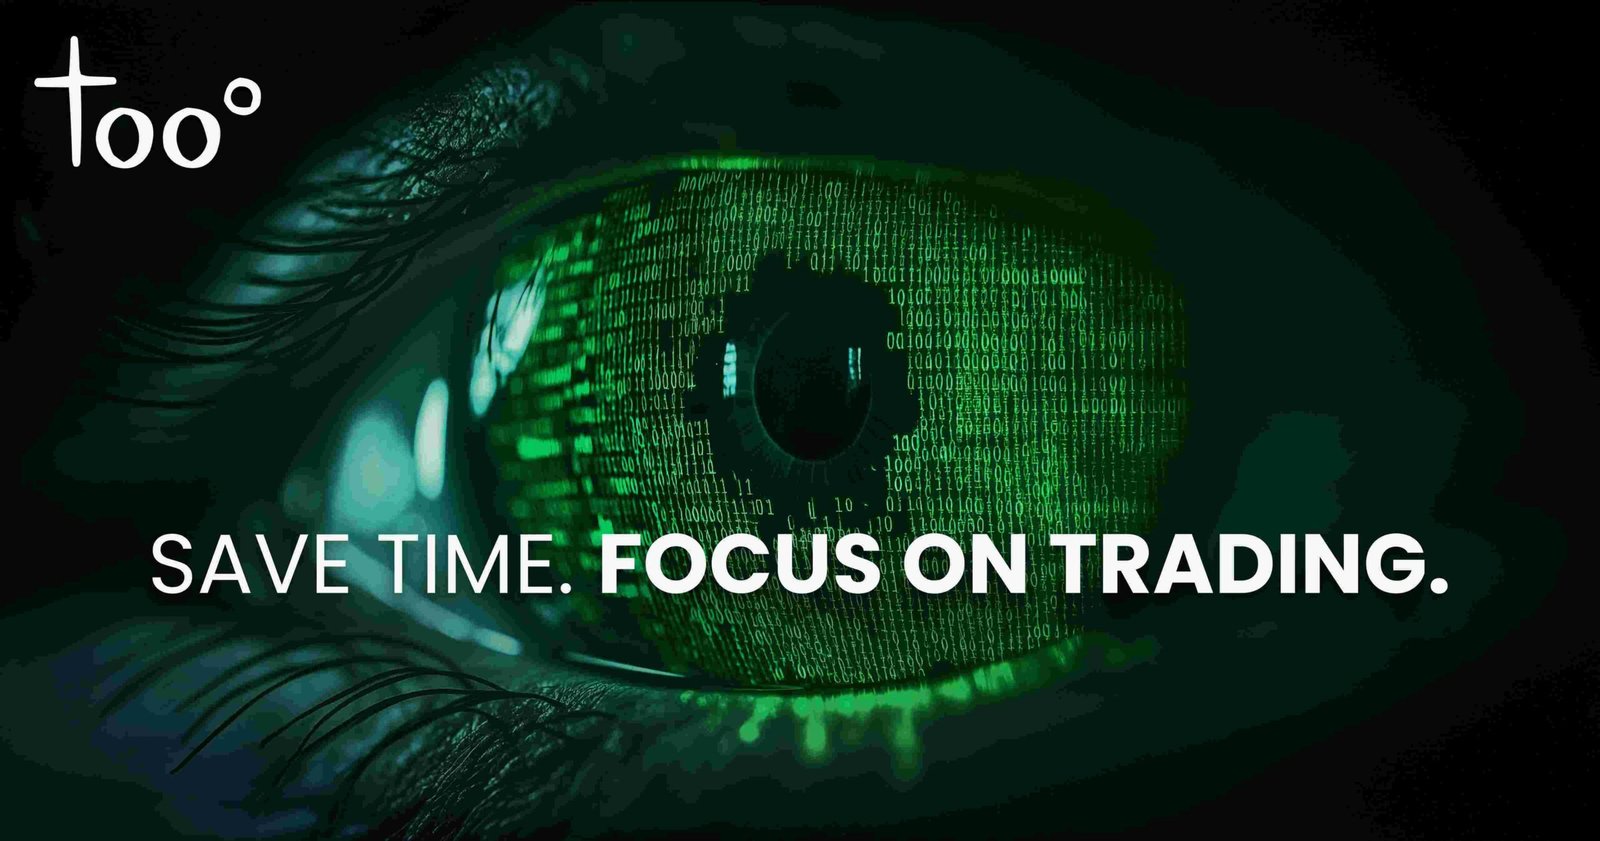
Quick Verdict: Toodegrees is a strong fit for traders who use TradingView and want ICT-style chart tools, cleaner structure recognition, and indicator support without turning their charts into a noisy dashboard. The main appeal is speed and clarity: Toodegrees helps traders see fair value gaps, fractals, liquidity concepts, session behavior, and higher-timeframe structure more efficiently.
Best fit: chart-focused traders who already care about price action, ICT concepts, or market structure and want better visual tools for studying setups, refining entries, and building a repeatable TradingView workflow.
Best Fit Snapshot
| Core benefit | TradingView indicators built around ICT-style market structure, fractals, fair value gaps, liquidity, OTE, session levels, and higher-timeframe context. |
| Strongest reason to join | Toodegrees can save charting time by turning complex structure into cleaner visual overlays that traders can study and apply with their own rules. |
| Good match if | You want to use TradingView more seriously, understand ICT terminology, and prefer chart tools that support your analysis instead of replacing your judgment. |
| Best way to use it | Start with one or two tools that match your trading style, study the documentation, test them on replay or paper trades, and add more only when the workflow is clear. |
Table of Contents
I. What Is Toodegrees?
Toodegrees is a TradingView indicator ecosystem built for traders who want to study price action and ICT-style market structure with cleaner visual support. Instead of functioning like a typical alert room, Toodegrees is better understood as a chart-tool brand. The value comes from indicators, documentation, community resources, and workflows that help traders identify structure faster.
That makes Toodegrees different from many trading communities on Whop. A signal community is usually judged by alerts, live calls, and trade timing. Toodegrees is judged by whether its tools help a trader read a chart more efficiently. If you already use TradingView, know what kind of setups you care about, and want cleaner visual context, the Toodegrees ecosystem is a relevant option to compare.
For beginners, the key is understanding what the tools are doing. A TradingView indicator is a script that adds visual information to a chart. An invite-only script is a private TradingView indicator that becomes available to your account after access is granted. ICT-style tools often focus on concepts such as fair value gaps, liquidity, optimal trade entry zones, session ranges, displacement, fractals, and higher-timeframe narrative. Those terms can sound technical, but the basic idea is simple: the indicator helps organize chart information so the trader can make a clearer decision.
For intermediate and advanced traders, Toodegrees is less about definitions and more about workflow. The right indicator can reduce manual marking, make repeated concepts easier to spot, and help a trader keep their screen consistent across markets. That does not make the tool a trading plan by itself. It makes the chart easier to interpret if the trader already has a plan.
A. A parent ecosystem for multiple indicators
Toodegrees is not one single indicator. It is a broader product family with multiple chart tools and access routes. That parent-ecosystem structure matters because different traders need different overlays. A futures scalper may care about fair value gaps and session structure. A swing trader may care more about higher-timeframe levels. A trader studying ICT concepts may want fractal structure, OTE context, liquidity depth, or RTH gap behavior.
The modular nature of the ecosystem is part of the appeal. A trader does not have to think of Toodegrees as one giant dashboard. It can be used as a toolkit. The cleaner approach is to select the tools that match your actual strategy, learn them deeply, and avoid adding indicators simply because they are available.
That is also why Toodegrees can be more useful than a generic indicator bundle. The brand is built around a specific trading language: structure, liquidity, fair value gaps, fractals, session behavior, and TradingView execution. If that language matches how you already study markets, the tools will be easier to evaluate.
B. Why TradingView traders care about this type of tool
TradingView is popular because it is flexible, visual, and accessible across markets. A trader can use it for stocks, forex, futures, crypto, indices, and commodities. That flexibility is powerful, but it can also create chart clutter. Too many indicators can make a trader slower, not faster.
Toodegrees is strongest when it improves chart clarity. A useful indicator should make a recurring concept easier to see. It should not make the trader dependent on the screen. For example, a fair value gap tool can help mark imbalance areas. A fractal tool can help highlight repeating structure. A volatility or session tool can help frame the trading day. These are not magic signals; they are visual aids that support analysis.
PTI has a broader guide to algorithmic trading indicators for readers comparing tools across platforms and use cases. Toodegrees fits that category because the product is built around chart automation and structured market visualization.
II. Indicators, Chart Tools, and TradingView Workflow
The best way to evaluate Toodegrees is to think through how a trader would actually use the tools during a trading week. The goal is not to place every available overlay on the chart. The goal is to create a repeatable workflow that helps the trader prepare, observe, decide, and review.
A. Fair value gaps, IFVG, and structure tools
Fair value gaps are one of the most common ICT-style concepts traders look for. In simple terms, a fair value gap points to an area where price moved quickly enough to leave an imbalance on the chart. Some traders watch these areas for potential reactions, continuation, or retracement behavior. An inversion fair value gap, often shortened to IFVG, focuses on how a prior imbalance may shift role after price moves through it.
A tool such as IFVG Pro+ can be useful because it reduces manual marking and makes those areas easier to monitor. The trader still needs to understand context. A highlighted zone is not a trade by itself. The value is that the zone becomes easier to study alongside trend, liquidity, session timing, and risk.
This is the larger Toodegrees pattern. The indicators are most useful when they support decisions the trader already understands. They can make the chart cleaner and faster, but the trader still needs rules around entries, exits, invalidation, and position size.
B. Fractals, liquidity, and higher-timeframe context
Fractal and liquidity tools are another important part of the Toodegrees ecosystem. Fractals help traders think about repeating structure across timeframes. Liquidity tools help identify areas where stops, resting orders, or important price levels may attract attention. Higher-timeframe tools help connect a lower-timeframe setup to a broader market story.
This matters because many traders lose context when they zoom in too far. A one-minute chart may look exciting, but the higher timeframe may tell a completely different story. Toodegrees tools can help organize those layers so a trader is not making every decision from one narrow view.
For example, a trader could begin the day by checking higher-timeframe direction, note important liquidity areas, watch how price behaves around a session level, and then use a fair value gap or fractal tool to refine the smaller setup. That sequence creates a workflow instead of a random screen full of signals.
C. OTE, RTH gaps, volatility, and session behavior
Toodegrees also includes tools connected to concepts such as OTE, RTH gaps, volatility mapping, average ranges, and session behavior. OTE stands for optimal trade entry, a concept many ICT-style traders use when looking for a retracement area inside a larger move. RTH refers to regular trading hours, which can matter for traders comparing overnight movement to the main cash session.
These tools can be especially useful for futures, index, and intraday traders because session behavior often shapes the day. A trader watching NQ, ES, SPY, SPX, or major forex pairs may care about where the market opened, where liquidity sits, what range has already been used, and whether current movement is expanding or fading.
Toodegrees helps by keeping that information visible. The benefit is not that every tool predicts price. The benefit is that the trader can review the same structural information consistently, which can make journaling and pattern recognition easier.
D. Community resources and documentation
Indicator access is more valuable when there is education around it. Toodegrees includes community and learning resources around the tools, which matters because many indicators are only useful after the trader understands how to configure and interpret them.
A good first week with Toodegrees should start slowly. Choose one indicator. Watch the available education around it. Add it to TradingView. Study old charts. Use replay if possible. Note when the tool helps and when it does not add anything meaningful. Then build a simple rule set for how it fits your actual trading process.
That approach helps prevent indicator overload. The common mistake is adding too many visual tools and then assuming more information means better decisions. Toodegrees is strongest when it makes the chart cleaner, not busier. A trader should be able to explain why each tool is on the chart and what decision it supports.
III. Public Reviews and Trust Signals
Toodegrees has a large public feedback footprint for a chart-tool brand, and the useful review themes line up with the product’s purpose. Members tend to focus on cleaner charting, time savings, indicator usefulness, education resources, and the way specific tools help them see structure more clearly.
The strongest positive signal is that feedback usually centers on practical chart use. People are not only responding to branding. They are talking about tools that help with entries, structure, and chart organization. That matters because indicator products need to prove their value during the actual charting process, not only in screenshots.
| Public review theme | What it suggests for traders |
|---|---|
| Cleaner chart structure | Members value indicators that make key concepts easier to see without manually marking every area. |
| Time savings | The tools can reduce repetitive chart work for traders who already know what they are looking for. |
| ICT-style usefulness | The strongest fit is a trader who understands concepts such as FVG, IFVG, OTE, liquidity, fractals, and session structure. |
| Education and support resources | Documentation and community access can help members learn how each tool should be used instead of guessing from the chart alone. |
Public feedback should still be read realistically. An indicator can make analysis cleaner, but it cannot remove trading risk or replace a trading plan. The best takeaway is that Toodegrees appears strongest for traders who want chart tools that support an existing methodology. It is less about excitement and more about making repeatable analysis easier.
IV. Who Toodegrees Fits Best
Toodegrees fits traders who want their charts to become more organized, not more complicated. The strongest match is someone who already uses TradingView, understands the type of setups they want to trade, and wants tools that make recurring structure easier to spot.
A. Beginner traders learning market structure
Beginners can use Toodegrees, but they should approach it as education support. A beginner who does not understand fair value gaps, liquidity, session behavior, or risk management may feel overwhelmed if too many tools are added at once. The better path is to learn one concept at a time and use one indicator to make that concept easier to recognize.
A beginner’s first step should be to understand the chart language. What is the indicator marking? Why might that area matter? How does it fit the trend, session, and risk? If those questions are answered slowly, Toodegrees can help a newer trader build cleaner visual memory around price action.
B. Intermediate traders refining entries and workflow
Intermediate traders are likely the strongest fit. They often have enough knowledge to understand the concepts, but they still need a more consistent workflow. Toodegrees can help this type of trader reduce manual chart work, keep structure visible, and review setups more consistently.
The best intermediate use is to connect each indicator to a specific decision. One tool may help identify imbalance. Another may help mark higher-timeframe context. Another may help frame session behavior. When each tool has a job, the chart becomes easier to read. When every tool is added at once, the chart becomes harder to trust.
C. Active traders who want cleaner TradingView screens
Active traders may use Toodegrees to make intraday preparation faster. This is especially relevant for traders who watch futures, indices, forex pairs, crypto, or high-volume equities. A cleaner visual workflow can help them prepare levels, evaluate structure, and review the day without manually rebuilding the chart every session.
For active traders, the key is discipline. Toodegrees can show structure, but the trader still decides whether the setup is worth taking, where risk belongs, and whether the current market is clean enough to trade. PTI’s trading risk management guide is a useful companion because indicator clarity should always be paired with position sizing and loss limits.
V. Toodegrees FAQ
A. What is Toodegrees?
Toodegrees is a TradingView indicator and chart-tool ecosystem focused on ICT-style concepts, price action, market structure, fair value gaps, fractals, liquidity, session behavior, and higher-timeframe context.
B. Is Toodegrees a trading signals group?
Toodegrees is better evaluated as an indicator and chart-tool ecosystem. The main value is visual market structure support inside TradingView, plus related community and education resources.
C. What are TradingView invite-only scripts?
Invite-only scripts are private TradingView indicators that become available to an approved TradingView account after access is granted. They appear inside TradingView and can be added directly to a chart.
D. What types of indicators does Toodegrees offer?
Toodegrees includes tools connected to fractals, fair value gaps, inversion fair value gaps, liquidity, OTE, session ranges, RTH gaps, volatility, average ranges, and higher-timeframe power-of-three style structure.
E. Is Toodegrees good for beginners?
Toodegrees can help beginners learn market structure visually, but newer traders should start with one concept and one tool at a time. It works best when the trader studies what the indicator is marking instead of treating every visual cue as a trade signal.
F. What markets can Toodegrees tools support?
Because the tools run through TradingView, they can support traders studying many chartable markets, including futures, forex, stocks, crypto, indices, and commodities, depending on the trader’s strategy and available data.
G. What is the best way to use Toodegrees?
Choose the indicators that match your trading style, study the documentation, test them on historical charts, connect each tool to a specific trading decision, and keep risk rules separate from the indicator itself.
VI. Final Take
Toodegrees is one of the more distinctive Whop trading-tool brands because it is built around TradingView workflow instead of a standard alert-room format. The strongest reason to consider it is simple: if you already care about ICT-style market structure, the right Toodegrees tools can make that structure faster and easier to study.
The most important point is to use it intentionally. Toodegrees works best when each indicator has a purpose. A fair value gap tool should support imbalance review. A fractal tool should support structure recognition. A session or higher-timeframe tool should support context. When the tools are used that way, they can make a trader’s charting cleaner and more repeatable.
If you are searching for a Toodegrees review, Toodegrees TradingView indicators review, Toodegrees Whop review, ICT indicator review, IFVG Pro review, or Fractal Model indicator review, the key question is whether you want chart tools that support your own analysis. If that is the goal, Toodegrees is a strong ecosystem to evaluate through the official access route.